
Atharva
Back to work

Underdawgs · Sports technology · Mobile

Performance data,
made useful.

A player app that replaced delayed PDF match reports, so footballers can revisit a match, understand their numbers and see their progress.

Placeholder
Sign in
Placeholder
Match stats
Placeholder
Player performance
Role
Sole designer
Team
1 designer · 3 developers
Timeline
3 weeks
Deliverable
Mobile app, V1

Problem

Some players waited close to a week for PDF reports full of unfamiliar metrics, with no easy way to see progress.

Solution

One mobile app to revisit a match, decode each metric and follow growth across sessions.

Impact

97% satisfaction and −63% drop-off, with 200+ new downloads

Problem

The data was there. The feedback loop was broken.

Roughly 20 shared Playermaker sensors captured on-pitch data. Manual syncing and sorting stood between each match and the player.

Where the old loop failed
  1. Match playedSensors capture the data
  2. Sensors syncedShared devices, many players
  3. Records sorted by handWrong-player records
  4. PDF report sentSometimes close to a week later
  5. Player reads aloneHard to decode or compare

Before

Feedback, delayed.

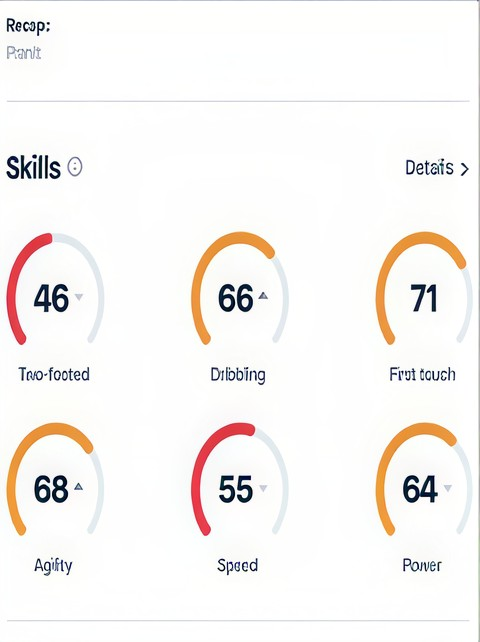
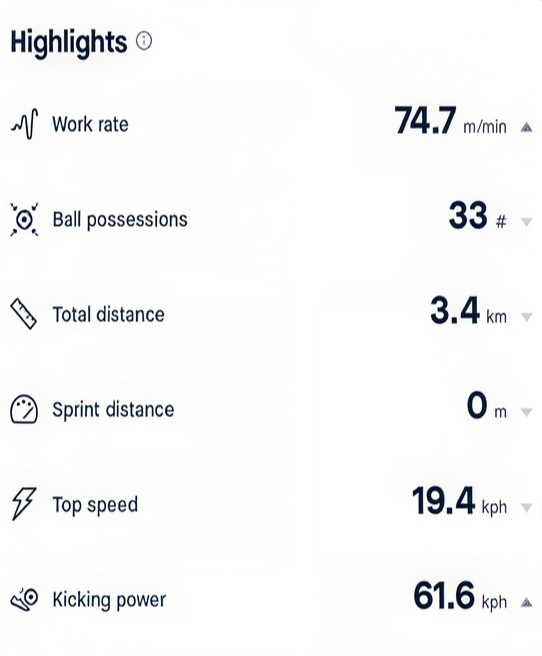
Original report crop showing six player skill scoresOriginal report crop listing work rate, possessions, distance, speed and kicking power
A separate PDF for every match, with dense metrics and no explanations.

After

A performance to explore.

Placeholder
One place for match context, metric explanations and growth.

Why not just give players Playermaker?

Access was tied to the physical devices. With about 20 sensors shared across a much larger group, players couldn’t have their own device or account, and the app wasn’t built around Underdawgs’ player-development journey.

Design challengeHow might we turn isolated reports into an experience players can explore, understand and grow with?

Research

Beyond the app. Into players’ routines.

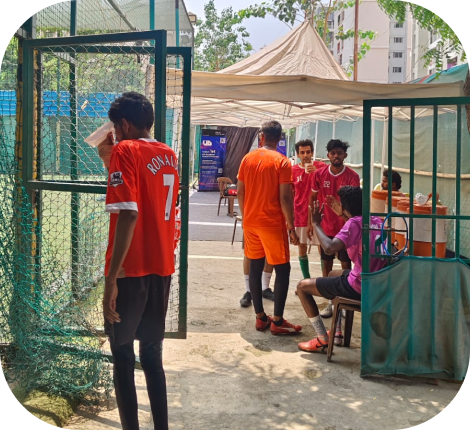
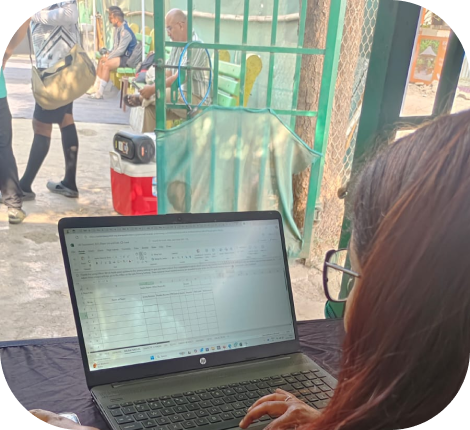
Underdawgs players gathered beside a football fieldResearcher observing the field while recording notes on a laptop
31

players aged 18–28 in Pune, gathered with the player relationship manager

  • Conversations with coaches and the CEO
  • Hands-on with sensor charging, pairing and sync
NeedWhat I foundWhat it meant for the design
AccessReports sometimes arrived after another match had been playedMake match history easy to find and revisit
UnderstandingUnfamiliar terms left some players unsure what the numbers meantShow the summary first, with detail on request
ContinuitySeparate PDFs hid progress, and coaches needed a longer view of consistencyConnect matches through growth and history views
TrustShared devices and manual handling risked player-data mix-upsTreat attribution as a dependency the interface can’t solve alone

Core insightPlayers weren’t asking for more data.
They needed a clear link between performance, progress and what to work on next.

Strategy

Three weeks. Three priorities.

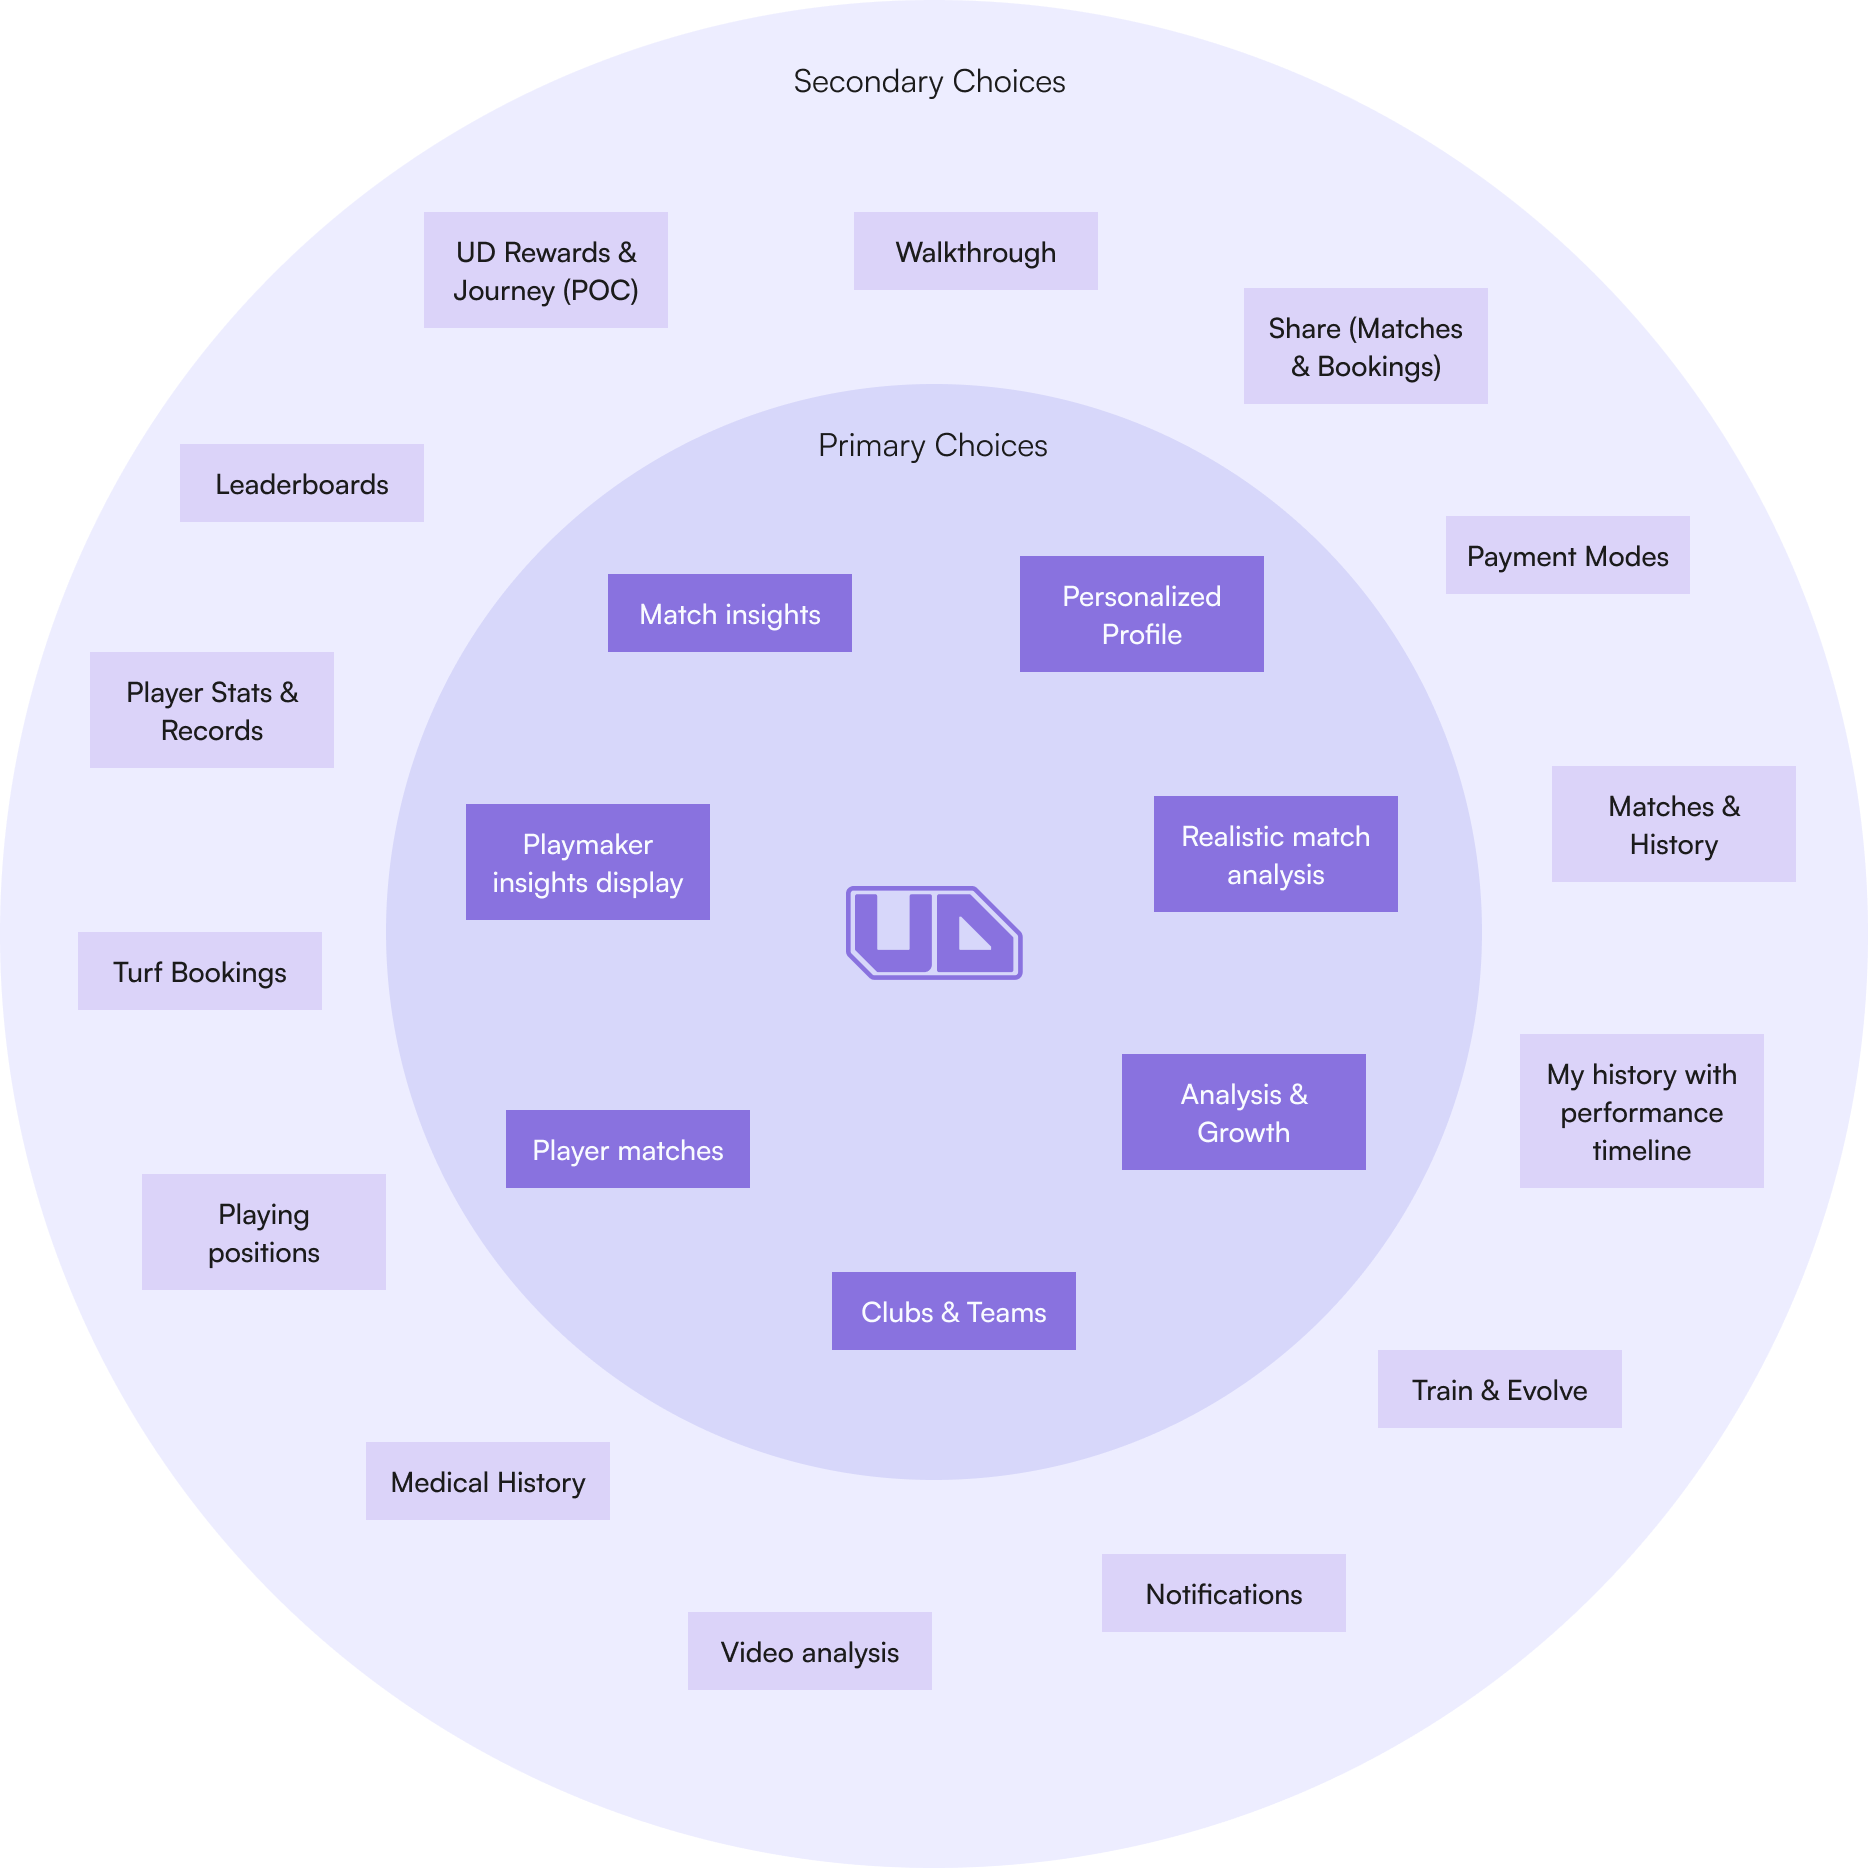
Booking, rewards, leaderboards and a premium tier were all under discussion. I focused V1 on making the core performance experience useful first.

Prioritized for V1

  1. Match insightsRevisit a match and your part in it
  2. Performance understandingSummaries with explanatory detail
  3. Growth and developmentHistory, attributes and training

Separate ambitions

  • Turf bookings
  • Rewards and leaderboards
  • A premium subscription
  • Automated personalized training
  • What happened in my match?

    • Match overview
    • Statistics and event timeline
  • How did I perform?

    • Individual performance
    • Metric explanations
    • Available highlights
  • Am I improving?

    • Performance overview
    • Match history
    • Training content

I explored three information architecture variations before choosing this one. Many players knew FIFA-style match summaries, which informed the match-to-player flow as a design reference.

Key decisions

Three decisions that shaped the product.

01

The match first, the details next

Views for match stats, an event timeline, individual performance and available video. Players start with the match, then move into their own contribution.

Trade-offSome match details came from manual tracking, so a clear layout couldn’t guarantee accurate capture.

Placeholder
Match timeline
Placeholder
Match videos
02

Reveal detail, don’t dump it

A summary-first view lets players scan quickly, then open any metric for an explanation. Comfort with analytics varies, so depth stays optional.

Trade-offAn explanation makes a metric easier to read. It can’t prove the measurement is right.

Placeholder
Metric summary
Placeholder
Metric detail
Placeholder
2-Footed detail
03

Design for the season, not just the match

A growth area connects player attributes, match history and training content, so each match leads to a meaningful next step.

Trade-offAutomated personalized training was out of V1 scope, so training stayed offline and coach-led.

Placeholder
Growth overview
Placeholder
Coach-supported training

Final design

One connected player journey.

  1. Find a matchRecent matches and history
  2. Explore performanceYour part in the match
  3. Understand a metricDetail when it’s useful
  4. Review growth and trainingWhat to work on next

Outcome

More useful feedback. Fewer players dropping off.

The team delivered V1 with structured match information, individual performance details, metric explanations and growth views.

  • 200+New downloads
  • 97%Satisfaction
  • −63%Drop-off

What I learned

Data becomes valuable when people can access it, understand it, trust it and use it to decide what comes next. Designing for that meant understanding the system behind the screen, not only the screen.

What I’d measure next

  • Time to insight
  • Metric comprehension
  • Correct player attribution
  • Repeat use and training usefulness